Function
Finance
Industry
Banking & Capital Markets, Business Services, Consumer Products, Energy & Resources, Hospitality, Insurance, Life Sciences & Healthcare, Manufacturing, Media & Communications, Other, Retail, Technology & Software, Telecom, Travel & Entertainment
Region
Europe, Middle East

The Profit& FP&A Solution is a collection of Anaplan applications, designed to fit together in a seamless process. They are designed to address the entire FP&A process including:
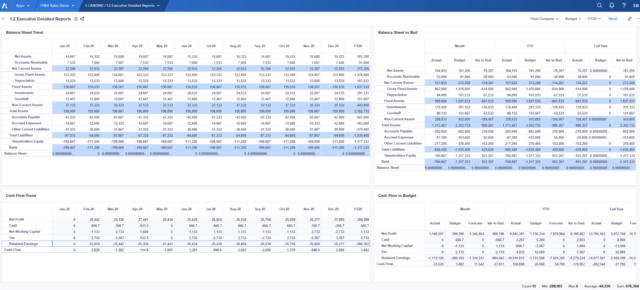
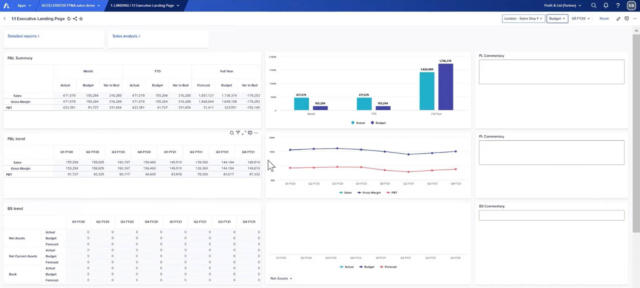
- Management reporting
- Forecasting
- Budgeting
- Analysis/“what-if” scenario planning
These processes are underwritten by a consistent data set or a single version of the truth.
The aim is to provide a modular approach to addressing most FP&A requirements, but doing it in short sprints that deliver a quick RoI.
Request a demoTechnology landscape
A key module of the Profit& FP&A Solution is the Load and Manage Data module. This acts as your Enterprise Performance Management datamart. In Anaplan, this is known as Datahub. This means that there is no need for long delays and expensive investment in a data warehouse. The Manage Data Module provides you with an easy to use user interface, to allow you to import and manage the right data into your model to drive your FP&A requirements.
The Manage Data Module then feeds the Profit& applications:
- Management reporting
- Forecasting
- Budgeting
- Analysis/“what-if” scenario planning
These applications are linked together through a common underlying data set and process flow which is pre-configured, enabling you to reduce project delivery times, costs and take advantage of industry best practises.
Solution features
The Profit& Financial, Planning, Reporting, and Analysis Accelerator in Anaplan provides the following benefits:
- Replaces many spreadsheets used to extract trial balance from the general ledger, transformation, and preparation of reports.
- Guides users through a process to populate the data needed from non-financial systems.
- This Year’s Actuals, as reported in Anaplan, are easy to load budget numbers and report actual vs. budget and variances.
- Next Year’s (NY) budget preparation process with remote Manual Data Entry includes overrides by departmental managers.
- Year To Go (YTG) forecast process.
- Rolling forecasts process (e.g., TY, YTD plus 12-month forecast).
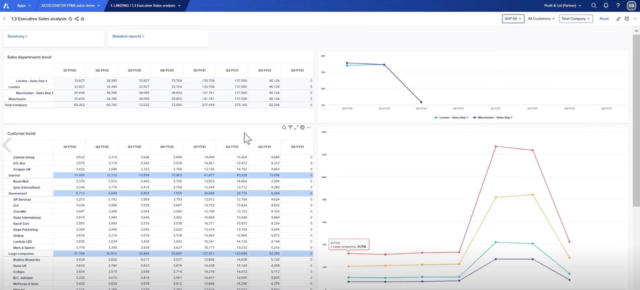
- Revenue forecasting.
- All of these use cases can be pre-populated in Anaplan using extrapolation rules.
- Managers can remotely update/override departmental values using pre-formatted and user-friendly manual data entry.
- Enterprise-wide reporting, summary dashboards including visuals, commentary, and manual data entry.